Top 10 AI Marketing Apps & Benefits – Power of Artificial Intelligence
2 years agoWhat is Google Analytics and How does it work in detail?
5 years ago -

Did you know how does Google Analytics work? Google Analytics is a critical tool for the success of a business online. It is now a requirement of any Digital marketing job because of Google Analytics, you can track whether your marketing is working or if there are technical issues blocking sales. If you’re a beginner, then this article will help you understand Google Analytics in detail and how it works for your website.
It helps to access the huge amount of information that is related to how users find and interact with your website.
For example, you can see how many users visited your site or a specific site, how long they visited there, when they dropped odd from there, where your visitors live, what kinds of certain keywords they used, and so forth.
Table of Contents
How does Google Analytics Work (History and Use Cases)
- Since its launch in 2005, Google Analytics has been a free tool. There is also a premium version called Analytics 320, but you do not need to upgrade unless you receive more than 10 million visitors in a month.
- In the layout of Analytics, you will log in to Home. You will see interesting information about your business. If you want more details about your business/ website, then those will appear in their sidebar, which breaks down into five categories:
- Real-time
- Audience
- Acquisition
- Behaviors
- Conversions
- There is a customization section in Google Analytics, which allows you to go beyond the standardized reports and create your own reports that potentially merge your company metrics and offline data with the data from Google Analytics.
- There is an Admin section that is used to set up a Google Analytics account.
Real-time
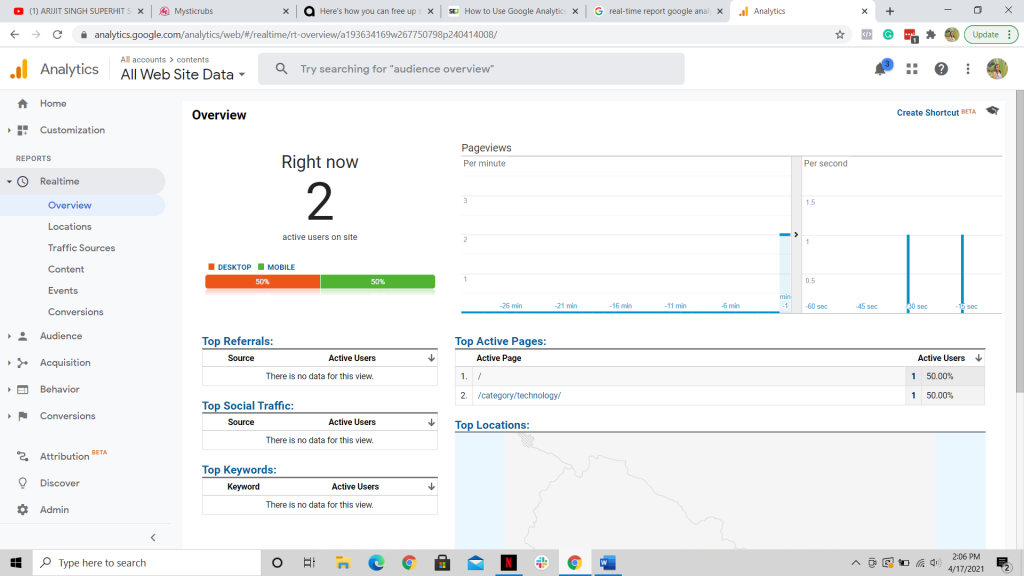
Real-time helps to show real-time information like who is on your site and what they are using or doing. If you post an awesome blog or post, and want to see how many people are using it in real-time. Real-Time appears in the left sidebar of your Google Analytics dashboard, where you can access real-time data by clicking it.
It shows the real-time reports of locations, traffic sources, content, events, and conversions.
Audience
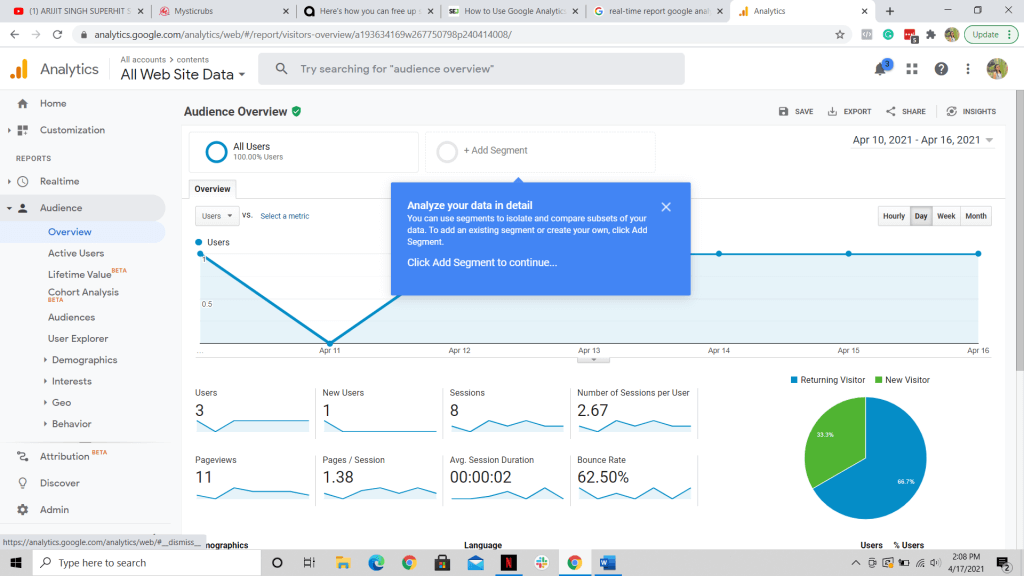
The audience shows the insight into the characteristics of your business’s users, like age, gender, location, a device to pinpoint online audience through Facebook Advertising, and more specifically, the target audience we target. This section tracks users who have visited your site in the last 1, 7, 14, or 30 days.
Acquisition
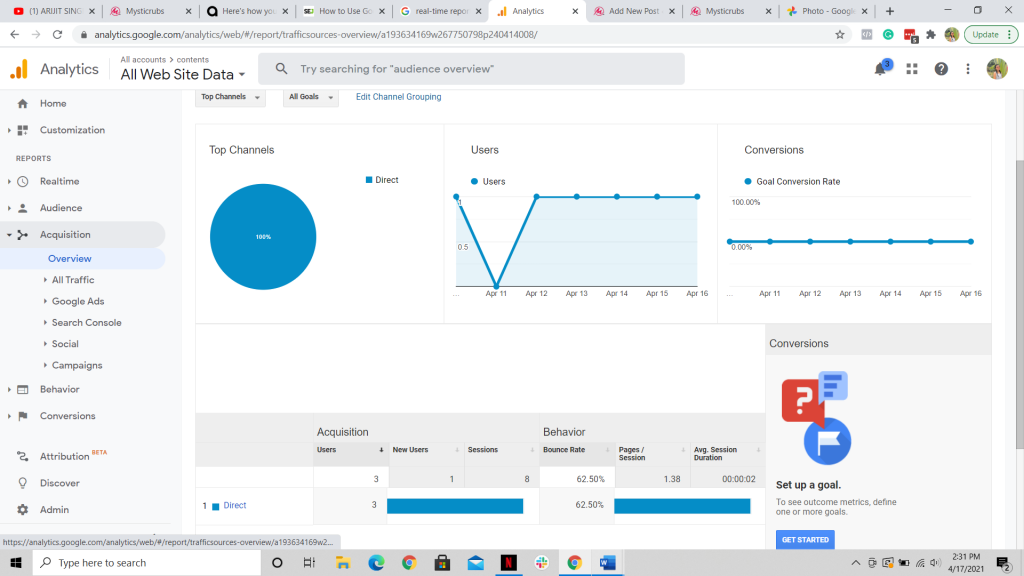
The acquisition shows how users arrive and find your website, what they do once they reach there, and if they complete the specific action (say filling a form). For example, if you see a lot of users coming from Facebook or other social media, then you can create content more specifically from which site they’re coming from (Facebook).
Behavior
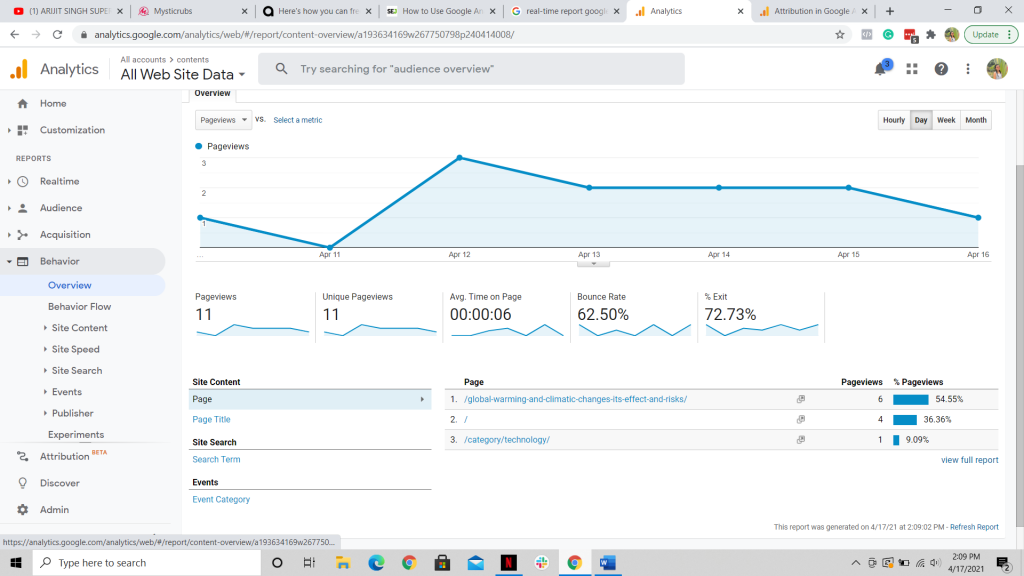
Behavior helps you to understand users as they interact with your site, and you can look at these reports to tell you where your site is leaking money, where your users are dropping off in the checkout process, etc. Also, helps you determine if new users are returning to engage with your content or not. Data can be viewed into 3 sub-categories: Frequency and Regency, New vs Returning, and Engagement.
Conversions
Conversion helps to track the success of your website goals, analyze their reports, and optimize your site so that you can turn more of your site visitors into email subscribers or paying customers. Like, how many users registered for your email list? How many users made a purchase?
How to Create a Google Analytics Account?
Many of the customizations depend on the types of business you run.
- Go to com/analytics
- Click on start for free
- Log in with a Gmail account
- Then follow the steps below:
(Install Tracking code: to collect data and see a report in Google Analytics, you need to install the tracking code on your website, and there are free ways for these steps)
- If you‘re using a WIX, Squarespace, Shopify, or other website builder, then you can just copy the Tracking ID and paste it into the admin section of your website.
- If you’re using WordPress, log in to your WordPress dashboard or install a new plugin “Monster Insight” and copy the tracking code and paste it either on it.
- Or simply use Tag Manager.
When you are developing a website, Google Tag Manager can help you handle the many tags you are using. Tags are JavaScript files (typically used for tracking) that pull from separate 3rd party services, such as Google Analytics, DoubleClick Floodlight Counter, or Adwords. This can slow down site load times since it must wait for a response from the 3rd party scripts before it can completely load your page.
A container tag is placed on each page of your website, and it pulls all the tags that you set up from Google Tag Manager. This simplifies the process for adding or removing scripts from your website, but it can also improve the load times. Google Tag Manager helps market a website since it allows you to quickly add tags to a container without having to access/edit the code of the website. In this tutorial, we will show you how to set up a Google Tag Manager account, which consists of 2 main steps: Creating a Google Tag Manager account (this will create a container), then adding the container to your web pages.
Create Google Tag Manager Account:
- Go to https://www.google.com/tagmanager/
- Click the Sign up now button.
- Enter an Account Name, choose if you want to share your data with Google, then click the Next button.
- On the next screen, enter a Container Name. Google suggests that you “name the container after the website.”
- Choose if you are going to use the Container on Web Pages or Mobile Apps. For this article, I chose Web Pages.
- It will drop down with additional options, choose your Time Zone, and click the Create Account and Container button.
- The Google Tag Manager Terms of Service Agreement will then be displayed. Click the I ACCEPT button to proceed. You will then see the code for your Container. In the next section, we will show you how to add it to your website.
How to Add the Container to your Site:
- Log in to the Google Tag Manager.
- Click Accounts, then click the account you want to set up.
- Select your container from the Containers section. Now, click Users & Settings, then Settings.
- Copy the provided code, it must be pasted into each page of your website. It will look similar to this:
- Log in to cPanel.
- Click the File Manager button in the Files section. If the Directory Selection window pops up, choose Web Root, then click Go.
- Navigate to where your website files are located. Now, click the site file you want to add the container to and click the Edit button. (If the Text Editor window pops up, click the Edit button)
- Paste the code immediately after the & lt <body> tag.
- Repeat Step 5 and Step 6 for each page of your site.
How to Confirm it’s Working?
Just open an incognito window from your browser and type your website link into the URL, and refresh the page in Google Analytics.
Now, you will see one active user on your website.
- Compared 12 Top OTA Platforms in 2026 (Booking.com vs. Tripadvisor)
- Top 10 Registered IVF Clinics in Nepal (2025)
- Top-Rated IT Training Institute in Kathmandu, Nepal You Can Trust!
- Step-by-Step Guide: 12 Steps to Create a Marketing Plan for Business Growth


![[2026 Updated] Top 10 Digital Marketing Agencies in Nepal Ranked!](https://mysticrubs.com/wp-content/uploads/2022/05/top-10-digital-marketing-company-in-nepal.png)


