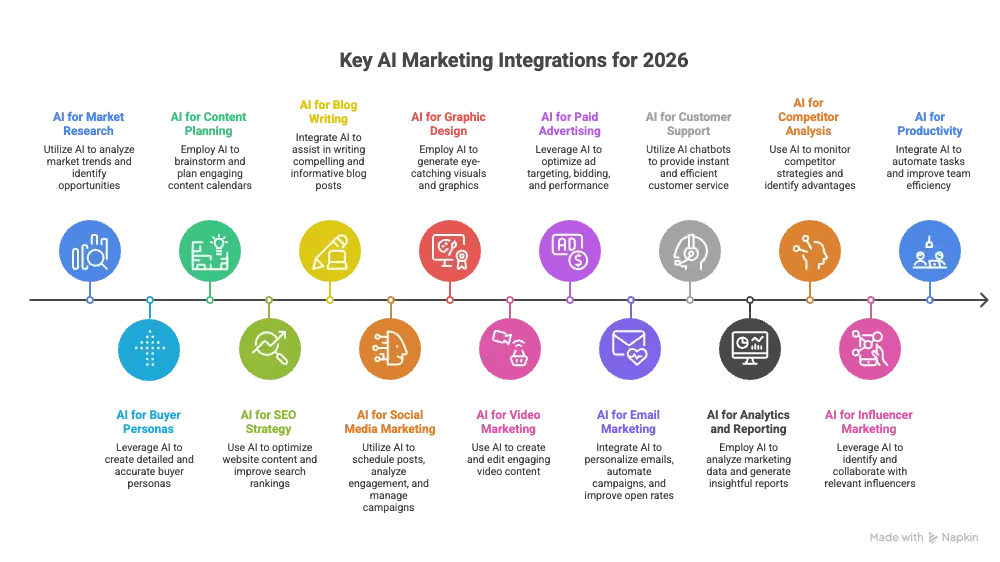
Top 10 AI Marketing Apps & Benefits – Power of Artificial Intelligence
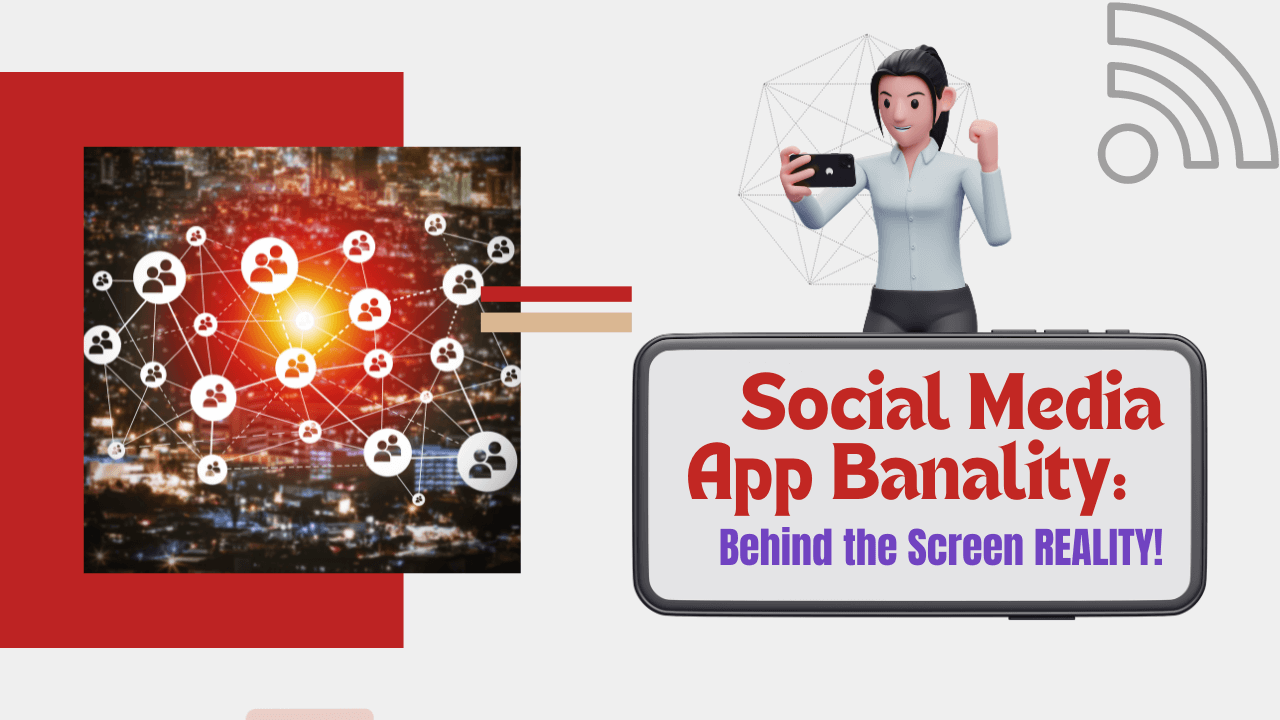
2 years agoBeyond Likes and Shares: Examples of Social Media Metrics That Drive Real Results
2 years ago -
Social media metrics involve a perfect balance of creativity and analytics. While creativity captivates, examples of social media metrics provide the essential data to measure performance. Understanding common examples of social media metrics is important for optimizing your strategy and driving business growth.
Table of Contents
Why measure social media key metrics?
Measuring examples of social media metrics offers valuable insights into audience behavior, content performance, and overall brand health. Marketers can make data-driven decisions by tracking key metrics or indicators, identifying trends, and calculating return on investment (ROI). Moreover, examples of social media metrics provide essential data to inform broader business strategies and demonstrate the value of social media efforts.
5 Key social media metrics to monitor

- Brand awareness metrics: Impressions, potential reach, mentions, links to the content, and shares are essential for gauging brand visibility and exposure.
- Engagement metrics: Applause rates (likes, retweets, favorites), comments, and shares reflect audience interaction and content resonance.
- Conversation metrics: Monitoring mentions and replies helps understand customer sentiment, identify opportunities, and address concerns promptly.
- Conversion metrics: Tracking website traffic, referrals, and conversions demonstrates the impact of social media on driving business goals.
- Customer satisfaction metrics: Customer testimonials, net promoter score, and reply time measure customer satisfaction and loyalty.
Essential Examples of Social Media Metrics KPIs
Here are some examples of social media metrics KPIs that you can track:
1. Example of Engagement Metrics
- Likes: Number of likes on your posts.
- Comments: Number of comments on your posts.
- Shares: Number of times your posts are shared.
- Reactions: Different reactions (e.g., love, haha, wow).
- Mentions: Number of times your brand or hashtag is mentioned.
- Saved Posts: Number of times users save your posts.
Example:
A brand posts a video on Instagram that gets:
- 500 likes
- 100 comments
- 50 shares
- 10,000 impressions
Engagement Rate Formula:
(500 + 100 + 50) / 10,000 * 100 = 6.5% Engagement Rate
A 6.5% engagement rate indicates solid content performance, especially if the industry benchmark is around 4-5%.
2. Reach Metrics
- Impressions: Number of times your content is displayed.
- Reach: Number of unique users who have seen your content.
- Profile Visits: Number of visits to your social media profile.
Example:
A tweet reaches 15,000 unique users during a campaign launch.
Tracking this metric shows that 15,000 potential customers were exposed to your message, giving you insights into brand visibility.
3. Follower Metrics
- Follower Count: Total number of followers.
- Follower Growth Rate: Increase or decrease in followers over a specific period.
- Demographics: Information about your followers’ age, gender, location, etc.
Example:
Your brand starts with 5,000 Instagram followers at the beginning of the month. By the end, you gain 500 new followers.
Growth Rate Formula:
(500 / 5,000) * 100 = 10% Growth Rate
A 10% follower growth rate within a month suggests your campaigns are attracting new audiences.
4. Click-Through Metrics
- Click-Through Rate (CTR): Percentage of users who clicked on a link in your post.
- Link Clicks: Number of clicks on links in your posts.
- Bio-Link Clicks: Number of clicks on the link in your bio.
Example:
A Facebook ad promoting a discount gets:
- 2,000 impressions
- 80 clicks
CTR Formula:
(80 / 2,000) * 100 = 4% CTR
If the industry standard is 2%, a 4% CTR reflects compelling ad copy and visuals.
5. Conversion Metrics
- Conversions: Number of users who completed a desired action (e.g., signing up, purchasing).
- Conversion Rate: Percentage of users who completed a desired action.
- Cost Per Conversion: The Amount spent on advertising divided by the number of conversions.
Example:
An Instagram Story link to a product page results in:
- 1,000 clicks
- 50 purchases
Conversion Rate Formula:
(50 / 1,000) * 100 = 5% Conversion Rate
A 5% conversion rate indicates that your post effectively drove users to make a purchase.
6. Video Metrics
- Views: Number of times your video content is viewed.
- View Duration: Average time users spend watching your video.
- Completion Rate: Percentage of users who watched your video until the end.
Examples
View Example: A YouTube tutorial video receives 10,000 views in the first week.
Insight: High views indicate strong content appeal and potential reach
Watch Time Example: A Facebook Reels video has a total watch time of 5,000 minutes over 7 days.
Insight: Longer watch times suggest higher engagement and audience interest.
Audience Retention Example: A 2-minute TikTok video shows 80% of viewers dropping off after 40 seconds.
Insight: A sharp drop-off may indicate that the content needs better pacing or storytelling.
Video Shares Example: A LinkedIn product demo video gets shared 200 times within a professional community.
Insight: Sharing indicates valuable and informative content.
7. Customer Service Metrics
- Response Time: Average time it takes to respond to comments or messages.
- Resolution Rate: Percentage of customer service issues resolved through social media.
- Customer Satisfaction Score: Measure of customer satisfaction based on feedback.
8. Campaign Metrics
- Hashtag Performance: Engagement and reach of specific campaign hashtags.
- Campaign ROI: Return on investment for specific social media campaigns.
- Traffic Sources: Origin of traffic to your website from social media (e.g., direct, referral, social).
Social Media Campaign Examples
Conversion Rate Example: A lead generation campaign receives 1,000 clicks, with 100 users filling out a sign-up form.
Conversion Rate Formula: (100/1,000) * 100 = 10% Conversion Rate
Insight: High conversion rates indicate an effective landing page and targeting.
Cost Per Click (CPC) Example: A $500 Facebook Ads campaign generates 250 clicks.
CPC Formula: $500 / 250 = $2 CPC
Insight: Lower CPC indicates cost-efficient targeting and campaign success.
Return on Ad Spend (ROAS) Example: An Instagram campaign spends $1,000 and generates $5,000 in sales.
ROAS Formula: $5,000 / $1,000 = 5x ROAS
Insight: Higher ROAS suggests strong campaign profitability.
Lead Generation Metrics Example: A campaign targeting webinar registrations generates 300 leads within a week.
Insight: Tracking leads helps assess campaign success in capturing audience interest.
9. Customer Sentiment
The tone and emotion expressed by users about your brand on social media.
- Helps improve customer experience and brand reputation.
- Use sentiment analysis tools or manually review comments and mentions.
Example:
A post about a new eco-friendly product receives the following comments:
- “I love this industry!”
- “Great move for the environment!”
- “Looks expensive, though.”
Using sentiment analysis tools, this feedback is categorized as 80% positive, 10% neutral, and 10% negative.
10. Share of Voice (SOV)
A metric that compares your brand’s social media mentions to those of competitors. Use Brand24 tool to track the social media kips SOV for your social media page or profile.
Example of SOV:
During a campaign, your brand gets:
- 300 mentions
- Competitor A gets 200 mentions
- Competitor B gets 150 mentions
SOV Formula:
(300 / (300 + 200 + 150)) * 100 = 46% Share of Voice
A 46% SOV suggests your brand is dominating conversations compared to competitors.
These social media metrics examples can help you evaluate the effectiveness of your social media strategies and make informed decisions to improve your online presence.
How to Use Social Media Metrics Example?
Using these examples of social media metrics offers valuable insights into your social media performance. By analyzing them, you can:
- Understand your audience: Identify demographics, interests, and behaviors.
- Measure content effectiveness: Determine which content resonates best.
- Track campaign performance: Evaluate the success of your marketing efforts.
- Optimize your strategy: Make data-driven decisions to improve results.
- Calculate ROI: Determine the return on your social media investment.
- How to Use AI Tools for Your Marketing Strategy (Complete 2026 Guide)
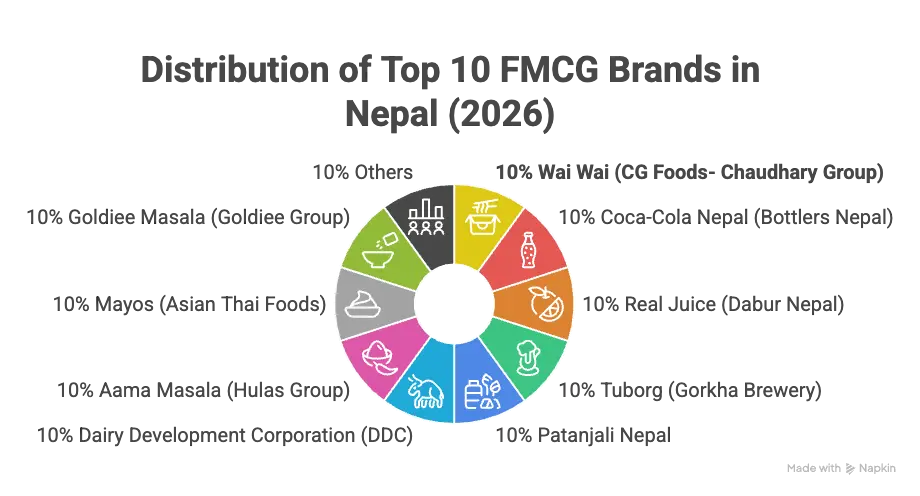
- Top 10 List of FMCG Companies in Nepal (2026 Updated)
- Step-by-Step Guide: 12 Steps to Create a Marketing Plan for Business Growth
- How to Optimize for Zero-Click Searches? Is It Bad for SEO?
Popular Post

![[2026 Updated] Top 10 Digital Marketing Agencies in Nepal Ranked!](https://mysticrubs.com/wp-content/uploads/2022/05/top-10-digital-marketing-company-in-nepal.png)
100% Best FREE SEO TOOLS 2025 for SEO Ranking
4 years ago